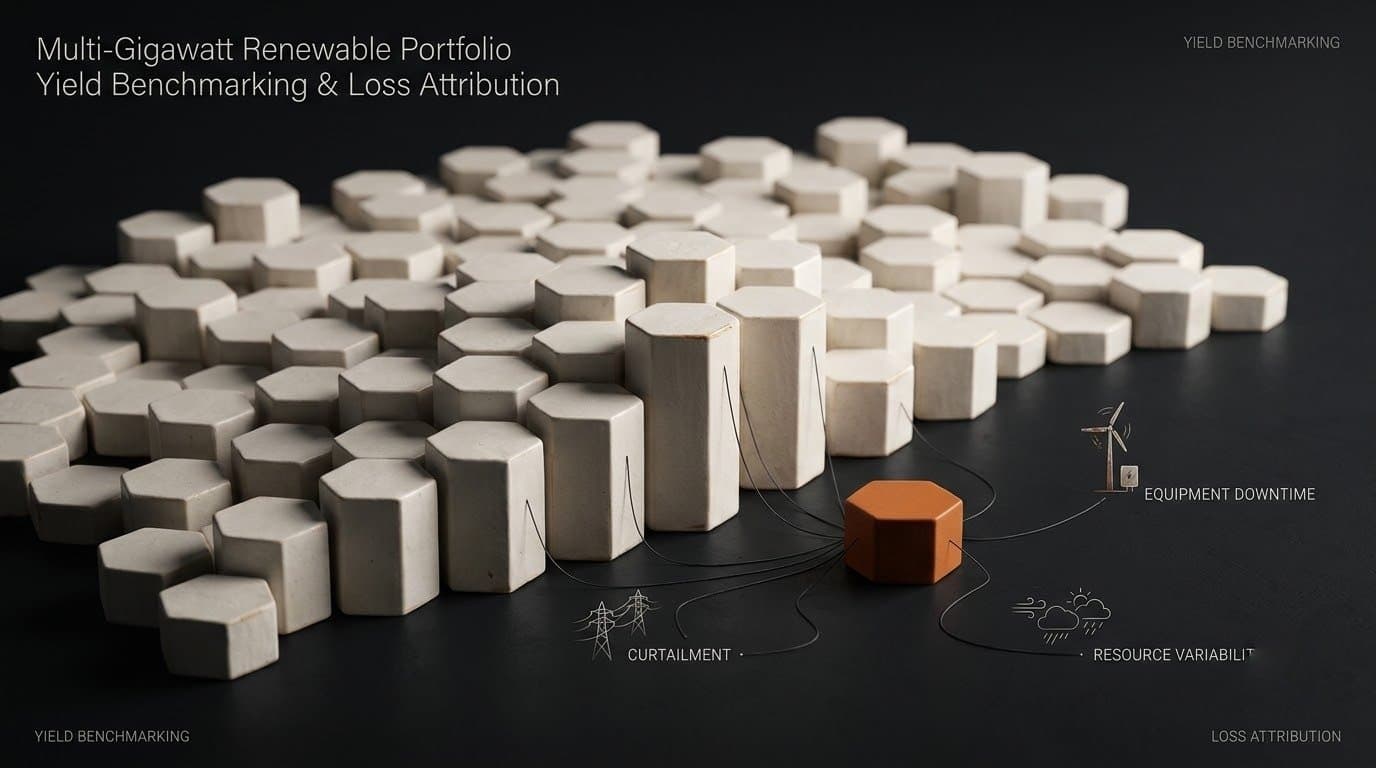
Multi-Gigawatt Renewable Portfolio Yield Benchmarking & Loss Attribution
An infrastructure investment fund overseeing 3.2GW of operational wind and solar assets across 45 project companies.
Run on Santulan · Renewable Performance
The challenge
Executive leadership lacked a single unified platform to evaluate which project companies and O&M contractors were performing below financial yield models.
Monthly performance reports from O&M vendors were delayed by 30 days and used inconsistent loss categorization definitions.
Isolating whether underperformance was caused by bad weather, equipment degradation, or grid curtailment was difficult.
How Santulan solves it
Unified Portfolio Asset Command Center
Santulan aggregates SCADA, weather data, revenue contracts, and O&M ticket logs across all 45 project companies into one cockpit.
Normalized Yield Benchmarking
Normalizes energy production against actual irradiance and wind resource availability, computing true Performance Ratio (PR) metrics.
Automated Loss Waterfall Attribution
Categorizes every lost megawatt-hour into clear loss buckets: Weather, Grid Curtailment, Equipment Downtime, Soiling, or O&M SLA Delay.
O&M Contractor SLA Auditing
Audits O&M vendor response times automatically against contractual downtime penalty clauses.
Financial P&L Risk Dashboard
Provides fund managers with live revenue tracking against debt service coverage ratios (DSCR).
The outcome
- recoverable generation losses across 8 underperforming solar
- $0Mrecoverable generation losses across 8 underperforming solar
- accelerated monthly portfolio financial reporting turnaround
- 0 daysaccelerated monthly portfolio financial reporting turnaround
Identified $4.1M in recoverable generation losses across 8 underperforming solar and wind projects.
Enforced O&M contractor SLA compliance penalties using objective automated SCADA data logs.
Accelerated monthly portfolio financial reporting turnaround from 30 days to instant live dashboards.
Representative scenario: a modelled industry situation showing how this accelerator applies. Figures are projections, not a named client result.
Capabilities used
Every accelerator is assembled from the same capability layer, so a workflow you adopt here shares its foundation with the rest of the portfolio.
More from Santulan
Operations
Dynamic Wind Turbine Yaw & Pitch Optimization for Annual Energy Production
An IPP renewable energy operator managing a 450MW offshore wind farm featuring 60 high-capacity wind turbines operating under complex turbulent wind wake conditions.
Maintenance & Reliability
Battery Energy Storage System (BESS) Degradation & Arbitrage Optimization
A clean energy asset manager operating a 100MW / 400MWh grid-scale lithium-ion Battery Energy Storage System (BESS) co-located with a solar PV farm.
Maintenance & Reliability
Predictive Solar Inverter Thermal Degradation & Maintenance Dispatch
A utility-scale solar asset owner operating 800MW of solar PV plants across arid desert regions containing over 300 central and string inverters.
Bring us the version of this that you actually have.
Every engagement is fixed-scope and outcome-guaranteed. The scoping conversation starts with your systems, not with a template.